HMI Tutorial
coast

Lesson 3 will cover DATA Displays. The Numerical Input features a display mode that displays teh current value of a device and an entry mode that enters a value using the keypad and writes that value to the a device.


Numerical Input

robotNumerical Input

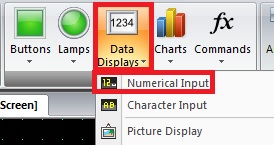
From the Home tab, in the Parts group, click Data Display and then Numerical Input .
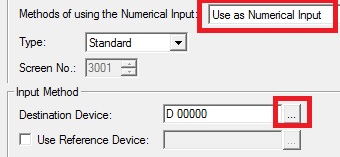


robotNumerical Input Properties

Click on a point in the eidt screen where you wish to place the Numerical Input. Double click the Numerical Input and the Properties dialog box will be displayed. Make Methods of using the Numerical Inptu as Use as Numerical Input. For Input Method Destination Device select the three dot box next to it.
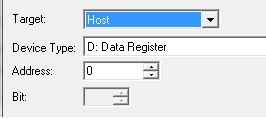


robotDevice Address Settings

For Target select Host and leave Device Type as a Data Register and address as 0. Hit ok twice. You have now a numerical input that you can put in a value to Data Register 0


robotData Format

If you double click on the numerical input you once again get the properties pop up to appear. You can change the Data Type, but for this example just leave it as Bin 16 (+). You can also select Display Floating Point and put in Floating Digit to have a decimal place. Ffor this example you will not select Display Floating Point.

robotData Type

If you are curious what Bin 16 and the others mean, here is a helpful chart.


Represent data on a bar chart

robotBar Chart

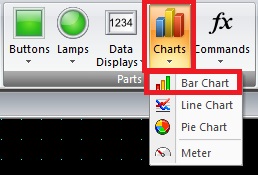
From the Home tab, in the Parts group, click Charts and then click Bar Chart.


robotBar Chart Vertical

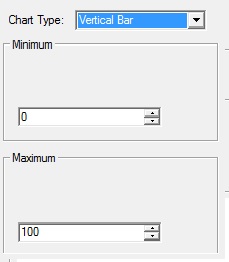
Click on a point on the screen where you want the bar chart to be displayed. Double click the image to get the properties dialog box to appear. For Data Type select Vertical Bar. For minimum and maximum put range from 0 to 100


robotReference Device

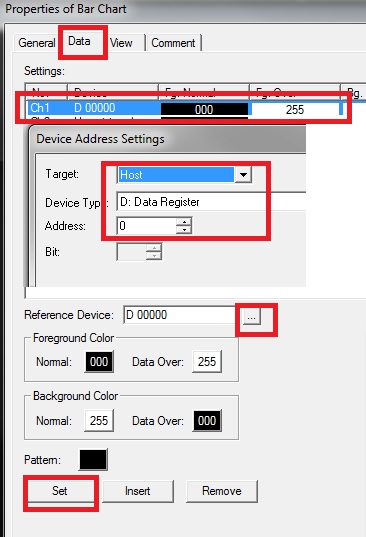
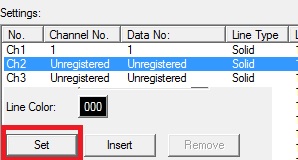
In the Data Tab highlight CH1 and click on the three dots next to Refernce Device and set target to Host, device type to data register and address as 0. Hit OK and then select Set adn then OK to accept.


robotTank background

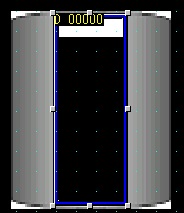
If you would like to have the bar chart have an image like a tank, then you can add an image. Please go back to Lesson 1 for Putting an Image on a base screen. In your symbol Factory go Tanks and select an appropriate one.


Displaying a Trend Chart

robotLine Chart

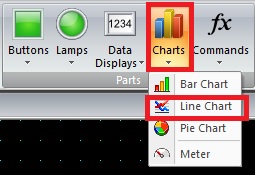
From the Home tab, in the Parts group, click Charts and then click Line Charts.


robotLine Chart Properties

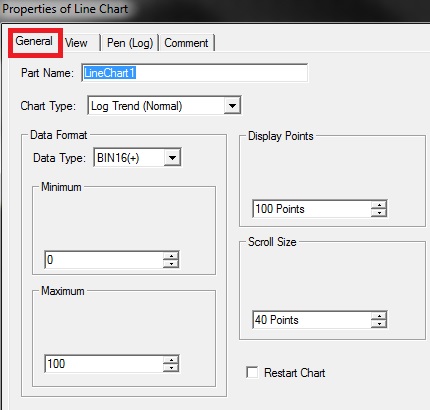
Click on a point on the screen where you want the trend chart to be displayed. Double click the image to get the properties dialog box to appear. Set the properties in the General tab as Chart Type Log Trend, Data Type Bin16+, Minimum 0 Maximum 100, Display points 100 Scroll Size 40


robotPen Log

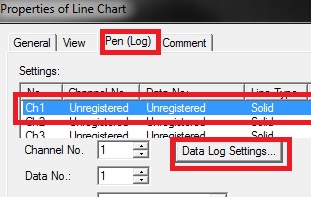
Select the Pen Log Tab. Highlight channel 1 and then select Data Log Settings


robotEdit Logging Settings

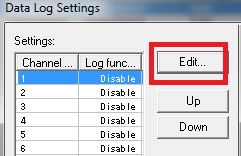
In the logging settings, select Edit


robotIndividual Device Log Setting

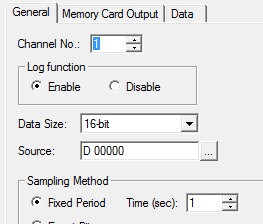
Set Device Log to 1. Enable the Device Log. Set Source to D 0. Sampling Method for fixed period of 1 second. Click ok


robotLogging Settings

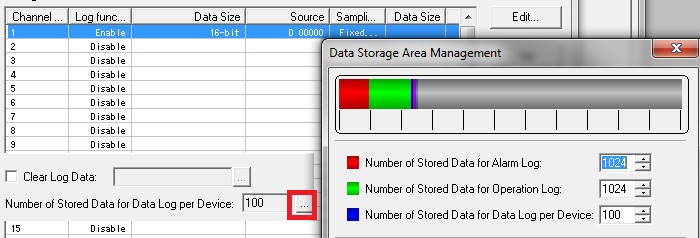
Logging Settings summary is as shown. Click OK Click on the three dot box next to number of stored data log to 100 Click OK and another OK.

robotRegister Value

Click the Set and now channel 1 should be programmed. Click OK to finish.